Friday, November 24, 2006
15min TF Breakout trade
Posted by
Michael
at
1:27 AM
0
comments
![]()
![]()
Sunday, November 05, 2006
Learning Forex Trading
Forget MLMs, Real Estate, HYIPs, and other high-risk, low return "business opportunities". unless it really work for you.
If you're looking for a REAL way to make money without much hassles as seen in today's working place. Although that Forex is not A GET RICH QUICK SCHEME whatsoever! If you are willing to put in your time, and sweat, to Learn trading forex, YOU WILL MAKE MONEY! it will really give you a financial freedom, Please just DO NOT EXPECT to be SPOON FED, becuase you will NEVER LEARN that way! YOU MUST PRACTICE AND TREAT THIS LIKE A BUISNESS! We're only to teach you various specialized systems for trading the FOREX (Foreign Currency Exchange Market)
Learn the few simple steps that can create $200 - $3000 within a month and trade for yourself. For those within Nigeria and Cote d'Ivoire .We offer one on one forex training.
Posted by
Michael
at
2:59 AM
0
comments
![]()
![]()
Friday, November 03, 2006
GMMA with MurreyMath Lines

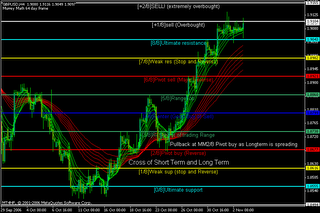
 On the top of MML8/8 the both short termGMMA and long term GMMA compressed before crossing each other which as it happen within the MML 8/8 is another Reversal confirmation to the cross of GMMA that the market is heading south.
Posted by
Michael
at
1:38 AM
0
comments
![]()
![]()
The Guppy Multiple Moving Average

How to identify trends and trading ranges using the Guppy Multiple Moving Average
The Guppy Multiple Moving Average (GMMA) indicator tool is based on the relationships between groups of moving averages.
Each group of averages in the GMMA provides insight into the behaviours of the two dominant groups in the market - traders and investors. The indicator allows the trader to understand the market relationships shown in the chart and so select the most appropriate trading methodology and the best tools.
The GMMA is designed to understand the nature of trend activity on an end of day, or intraday basis.
The inferred activity of traders is tracked by using a group of short term moving averages.
The traders always lead the change in trend. Their buying pushes up prices in anticipation of a trend change. Their activity is shown by a 3, 5, 8, 10, 12 and 15 day group of exponentially calculated moving averages.
The trend survives only if other buyers (Investors) also come into the market. Strong trends are supported by long term investors. The investor takes more time to recognize the change in a trend but he always follows the lead set by traders. We track the investors' inferred activity by using a group of long term moving averages. This group is 30, 35, 40, 45, 50 and 60 day exponentially calculated moving averages.
The relationship within each of these groups tells us When there is agreement on value - when they are close together and When there is disagreement on value - when they are well spaced apart.When we combine multiple moving averages, a short term group and a long term group, we can see when the market has reached an agreement about the value of the market.
This can be used to understand the strength of the trend. Sustained activity of the short term averages above the long term group confirms a strong trend.
The short term group will fluctuate, but while the long term group is in a steady band it suggests long term support.Signs of a weakening of the trend are when both groups of averages begin to narrow down and fluctuate more than is normal given their past recent activity.
If both groups converge towards a crossover, then a trend reversal is signalled.
The relationship between the two groups tells the trader about the strength of the market action. A change in price direction that is well supported by both short and long term investors signals a strong trading opportunity. The crossover of the two groups of moving averages is not as important as the relationship between them. No Signal? Then how do I use it? For my mind the greatest thing about this indicator is there are no real "signals" to say buy and sell. Instead this is a tool that actually allows us to step back a little and analyse recent price action relative to past price action. Rather than give us a signal it actually forces us to think about the market price and the market sentiment that is creating the prices. I suppose a well spread long term group is a signal of some kind in that it suggests the trend has been enjoying continued support
What Question(s) Does the MMA ANSWER?*
What is the underlying strength of this Trend?*
How far in to the developing trend is this Markets. Therefore is it an emerging trend, or an established trend etc. A well spread long term group is indicative of a healthy long term trend.
Will the trend continue, who knows?
But it has been strong to that point. If the long term group is highly compressed then the price has not been moving uniformly in any direction or the previous direction has weakened considerably.
The MMA also allows us to as certain where a market is in terms of trending action. We're looking for strong, consistent trends that aren't likely to reverse just after we enter the Market. The following points are critical; - The long term group must be spreading apart or running parallel with each other. - The long term group must be pointing upwards. - The straighter the long term groups of lines are; the less volatile the trend is. - The short term group can pullback (i.e. compress together) but they shouldn't come into contact with the long term group of averages This type of qualitative analysis is only used when entering the market and the idea is to avoid volatility. We want to 'Ride the Trend' and not get bounced in and out of the market.
To put this shorter term analysis into perspective, we turn to the Guppy Multiple Moving Average display. We use the Guppy Multiple Moving Average as one of our primary trend analysis tools. The retreat patterns discussed above remain consistent with this strong trend. A substantial retracement could take place and still remain consistent with the trend. The GMMA continues to show the strength of this trend. The long term group continues to maintain a consistent parallel separation.
The strength of the trend is confirmed by the reaction of the long term group of averages as the index drops or retreats. A strong bullish trend is suggested when the long term group of averages does not compress. It tells us investors are actively moving into the market and buying as they fall in price because they believe that these are still good value.
Traders may want to take short term profits, but investors take a longer view. Their reaction to price retreats creates the conditions for trend continuation. The indicator confirms that a substantial market retreat remains consistent with the long term underlying trend.
The GMMA is not a stand alone indicator. Our preference is to use it in conjunction with other indicator tools. These Include the support and resistance levels, and the trend lines discussed above. The GMMA also shows you what type of market you are in. Trending or ranging.They are great for discretionary trading. Add them to your toolkit for a while. It looks like they are taking up a lot of room, but to get the feel of the market, there is nothing better to have on your chart.
Posted by
Michael
at
1:02 AM
19
comments
![]()
![]()
Tuesday, October 31, 2006
Starc Band Breakout
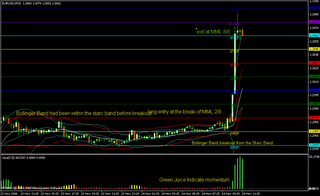
Looking at the 4Hrs chart, The shortterm GMMA had a pullback when the Long Term GMMA are spreading out showing the short term trend is likely to continue, immediately after the fractals formed, which is another indication that the bears are forcing the price down, I move down to 15 min chart to see looking for a break out of the Bollinger band from the starc band as seen in the above chart above.
Posted by
Michael
at
2:11 PM
0
comments
![]()
![]()
Saturday, October 28, 2006
Combining Various Indicators To Refine Entry


Fractals and BDB appear indicating a trend reversals as the one which appears on thegraph above shows Buy signal, the trigger lines changing colour from red to blue as well add there will be reversal, it all took place below Murrey Math Line3/8, the alligators later change direction and the 4H uptrend lines breakout with increase in Jucice is the last to confirm my entry for this combine setup
Posted by
Michael
at
2:41 AM
0
comments
![]()
![]()
Friday, October 27, 2006
Trading 4H Trendline Breakout
 Using Murrey math lines, fractals formation, candlestick parterns, and juices to take trading decisions.
Posted by
Michael
at
1:54 PM
0
comments
![]()
![]()
Thought
Thought
Thought is at the beginning of all creation. Change your thinking and you create the life you desire! Energy follows thought.
Perception
Perception is how you understand your world based on your experience filtered through your judgments. Energy is just energy...until a perception is placed upon it!
Choice & Accountability
You are accountable for the life you have created. Choice is unlimited. You may always choose again.
Cause & Effect
What we give out reflects what comes back to us multiplied.
What you give energy to?comes back multiplied.
Abundance & Gratitude
We constantly have an abundance of whatever we believe we deserve. When you believe in "lack" consciousness, you get paid by not having enough. With gratitude for all of life's gifts you will see an abundance in your life.
What you feed? will grow.
Health & Healing
Physical pain is the language the body uses to let us know something "isn't working"! Learn how providing balance brings health to your life! Love heals.
Harmony & Rhythm
There is a rhythm to all creation. When you resist the natural rhythm or "flow" of life, you create disharmony and pain.
Harmony is the basic rhythm for all creations.
Posted by
Michael
at
1:44 PM
0
comments
![]()
![]()


